Saudi industrial supply chains sit in the shadow of two non-substitutable maritime corridors: the Strait of Hormuz and the Bab al-Mandeb Strait. Recent reporting frames Hormuz as “the most significant and sustained use of chokepoint leverage in recent history,” and highlights how risk now has to be assessed and priced across networks that rely on a handful of maritime nodes. The Red Sea corridor has also shown how quickly traffic can fall when security deteriorates: after the October 7 attacks in 2023, carrier traffic through the Red Sea “significantly declined” as four of the five largest shipping companies paused or suspended service by the end of 2023, amid the threat of attack and higher insurance and container prices. For Saudi operators, the key takeaway is simple: chokepoint risk is not theoretical. It is operational.
A useful starting point for Saudi Arabia value chain risk analysis is to quantify “where the chain breaks” and what it costs when multiple corridors fail at once. In September 2026 analysis, commercial vessel traffic through Hormuz was reported to have collapsed by more than 90%, from roughly 125 daily sailings to about five vessels per day, with tanker trade volume down more than 98% over a 30-day comparison period. The same analysis recorded VLCC charter rates up to USD770,000 per day versus a pre-crisis baseline around USD117,000, and war-risk premiums above USD10 million per voyage. Separately, research estimates annual losses from chokepoint disruptions at USD10.7 billion per year, plus USD3.4 billion per year due to increased freight costs, with Suez and Bab al-Mandeb cited as key drivers. These are not abstract metrics; they define stress-test inputs.
A Mapping-First Framework to Find Chokepoints, Dependencies, and Reroute Limits
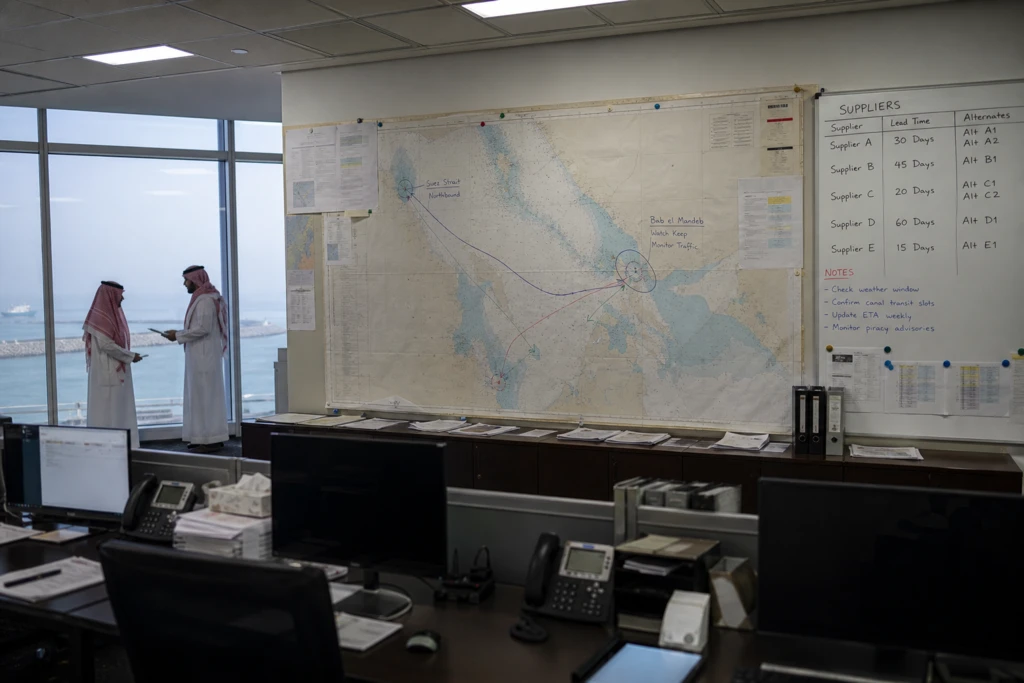
Step 1 is corridor mapping by product and leg, because a single supply chain can touch several chokepoints, and combined exposure is what matters. One consulting view makes this explicit: a Saudi exporter can face constraints at Hormuz, Bab al-Mandeb, and the Suez Canal, limiting rerouting options across different parts of its export network. Step 2 is input mapping, not just finished-goods mapping, because Hormuz disruption has been linked not only to oil and gas flows but also to aluminum, fertilizer, chemical feedstocks, and other critical inputs. Step 3 is “substitution logic” testing: another 2026 analysis argued that for the first time in the modern shipping era, Hormuz, the Red Sea, and the Black Sea were failing simultaneously, removing the workaround logic that made single-chokepoint crises manageable. The result is a harsher planning assumption: you may not have a safe alternate corridor when you need it.
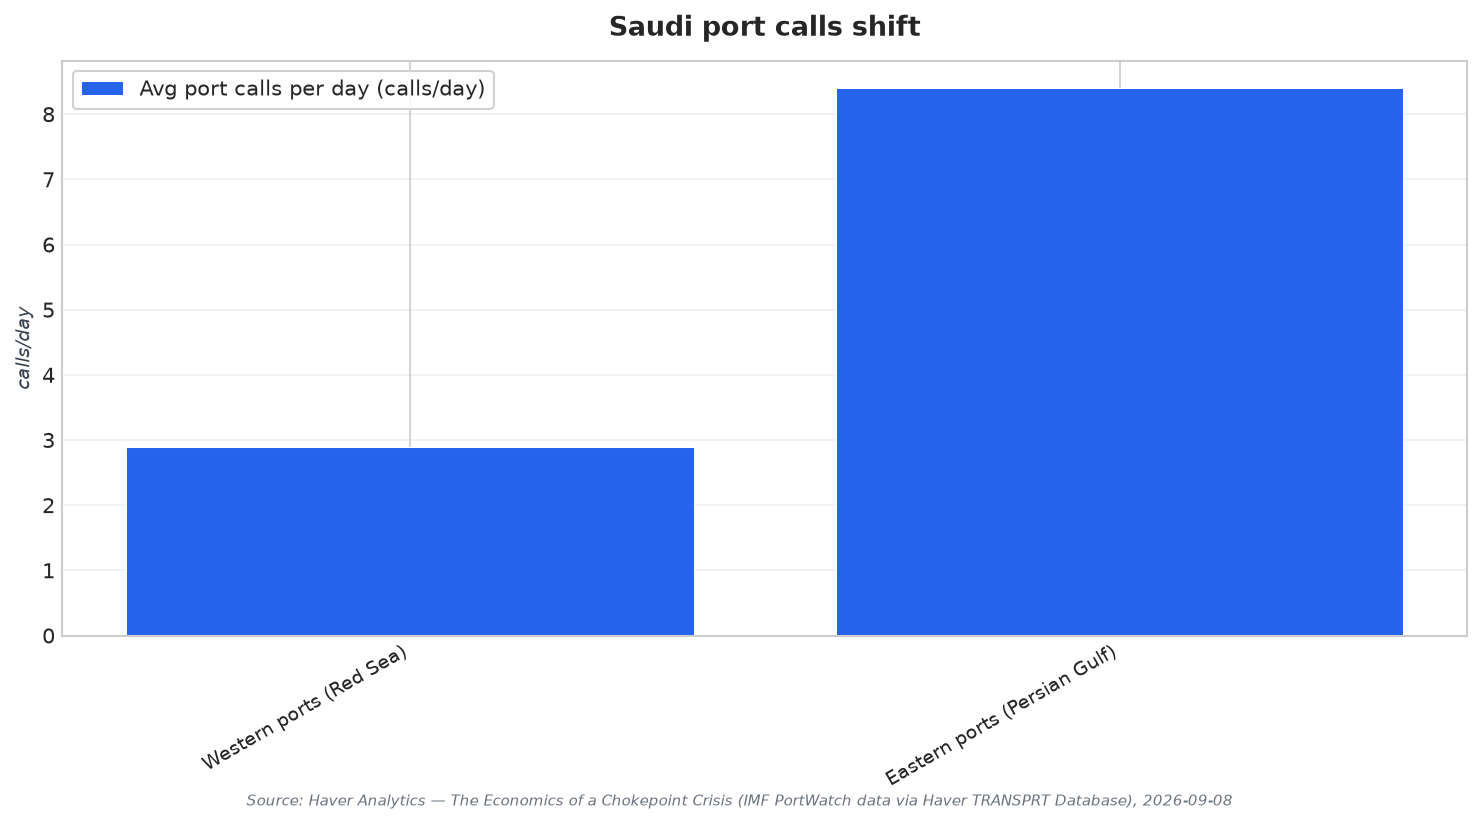
Step 4 is to measure real-world rerouting capacity using observable shifts, then translate those shifts into plant-level or contract-level exposure. One economic review using IMF PortWatch data described Saudi Arabia as “at the center of these disruptions,” noting oil exports were roughly 70–80% of its total export value over the past year (as reported in that source). It also states Saudi Arabia rerouted a share of crude away from the Persian Gulf to the western Red Sea via the overland east-west (Petroline) pipeline. During the first 30 days of the Hormuz closure, average port calls per day on western (Red Sea) ports rose to 2.9 from 2.6 (an 11.4% increase), while eastern (Persian Gulf) ports fell to 8.4 from 12.0 (a 29.8% decline). That same source reported Hormuz tanker trade volume collapsing to 22.8 thousand tons from 1.97 million tons over the previous 30 days, and also noted that the net volume through alternative corridors remained nearly steady and then began to fall in the latest month. Step 5 is to tag “route plus security” triggers: in July 2026, Yemen’s Houthi movement declared a naval blockade and maritime embargo on Bab al-Mandeb, tightening the reroute constraint.
The output of this framework is a prioritized list of chokepoint-linked bottlenecks by industry, supplier tier, and shipping leg, supported by stress scenarios that incorporate both duration uncertainty and repeat-closure risk. Sources also point to the strategic response direction: intensified enforcement against “shadow fleets” can raise escalation risk, while pressure on just-in-time models can accelerate near-shoring and friend-shoring, even if “geography and economics make certain dependencies unavoidable.” For Saudi industries, the practical goal is not to eliminate exposure overnight. It is to make it legible: map which chokepoints each value chain must transit, identify alternate routing and its limits, and compare cost differences under stress scenarios before a corridor “goes dark.”
What is the most practical first step in a Saudi Arabia value chain risk analysis for Hormuz and Bab al-Mandeb exposure?
What figures show how severe the Hormuz disruption can become?
What does the Saudi port-call data suggest about rerouting limits?
Why does Bab al-Mandeb matter even when the focus is Hormuz?